
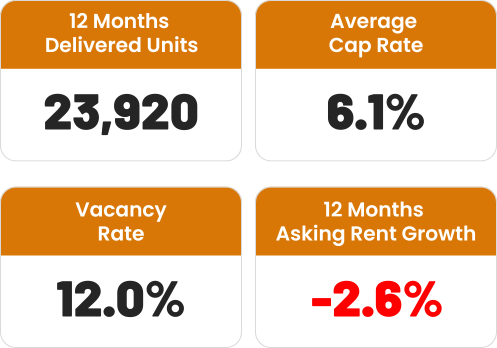
The Phoenix apartment market continues to face a persistent imbalance between strong demand and overwhelming new supply. Despite recording 18,000 units of net absorption over the past year—more than double the pre-COVID average—vacancy has climbed to 12% due to the completion of 24,000 new units and ongoing construction of another 24,000 units.
Phoenix ranks among the top 10 U.S. markets for demand but also among the most aggressively built, with the impact felt most in Downtown Phoenix, Tempe, and the Southwest Valley. Luxury properties are seeing higher vacancy and rent declines compared to more stable workforce housing.
Rent growth has been negative since early 2023, with the average asking rent down 2.6% and over half of communities offering concessions like 6–8 weeks of free rent. A slowdown in construction starts points to relief by 2026, but high vacancies and excess inventory suggest another year of rent declines ahead.
Phoenix MULTIfamily Market FAQ
1. Why is the Phoenix apartment market facing challenges right now?
The market is experiencing a persistent mismatch between strong renter demand and an overwhelming supply of new apartment units. This oversupply has led to rising vacancies and declining rents.
2. How strong is apartment demand in Phoenix?
Very strong. Over the past year, Phoenix recorded 18,000 units of net absorption—more than twice the pre-COVID five-year average. This ranks Phoenix among the top 10 U.S. markets for apartment demand.
3. What’s driving the increase in vacancy rates?
The main factor is excessive new supply. In the past 12 months, 24,000 new units were completed—over triple the annual average from 2015 to 2019. An additional 24,000 units are currently under construction.
4. What is the current vacancy rate in Phoenix?
As of the latest data, overall vacancy has reached 12%, and it may rise further as more new units come online.
5. Which areas are most affected by oversupply?
High-growth areas like Downtown Phoenix, Tempe, and the Southwest Valley are seeing the greatest accumulation of vacant units.
6. Are all types of properties equally affected?
No. Luxury (Class A) properties are experiencing higher vacancy rates and greater rent declines. Workforce housing (Class B & C) has been more resilient but is also seeing increased vacancy and slight rent drops.
7. What about rent growth and concessions?
Rent growth has been negative since early 2023. Over the past 12 months:
- Average asking rents declined 2.6%
- Luxury property rents fell 2.5%
- Over 50% of communities are offering concessions, often 6–8 weeks of free rent
8. When is the market expected to recover?
A slowdown in new construction starts is projected to ease supply pressure by 2026, potentially allowing for a market recovery. However, 2025 is likely to see continued high vacancy and negative rent growth.

:format(webp):quality(80)/u.realgeeks.media/capcorerealestate/badge_trans.png)
:format(webp):quality(80)/u.realgeeks.media/capcorerealestate/Facebook.jpg)